DataFam Roundup: January 27-31, 2025
Welcome! Dig into this week's DataFam Roundup—a weekly blog that brings together community content all in one post. As always, we invite you to send us your content—and the DataFam content from your peers that have inspired you! Find the content submission form here.
Community Highlight
To recognize new and consistent Tableau contributors—we’re excited to have a section within the weekly DataFam Roundup called the Tableau Community Highlight. Find out how to get involved.
Kasia Fernandes, Data Analyst & Tableau Expert
Zurich, Switzerland
Kasia Fernandes is a Data Analyst and Tableau Expert. She considers Tableau her go-to tool for building complex, dynamic dashboards, automating reports, and analyzing data. Kasia first encountered Tableau while working in HR, where she was tasked with recruiting a Tableau Developer, which sparked her interest in transitioning from HR to Data Analytics. She began learning Tableau through online tutorials and on-the-job experience, and is now actively involved in the Tableau Community though the Zurich Tableau User Group and sharing blogs on her Medium site, finding it to be a source of inspiration, learning, and networking.
After realizing that her HR team lacked data-driven insights, Kasia transitioned from HR to data analytics. She volunteered to clean up and analyze HR data, discovering her passion for data analysis. She shares her Tableau knowledge through her workplace role, which includes troubleshooting and delivering training sessions. She is excited about the future and the impact of AI.
Connect with Kasia on Linkedin, X, and Tableau Public.
DataFam Content
Dive into content created by the Tableau Community:
- Jim Dehner: Say Goodbye to Cartesian Joints
- Viraj Bhargave: Know the Tableau Start Page
- Sarah Pallett: Dashboard toggles made easy with Tableau's Single Checkbox Parameter Dashboard Extension
- Johan de Groot: Three easy to implement tips on BANs
- Tabitha Diaz: Tableau Tip: Removing Gridlines
- Deepak Holla:
- Kyle Massey: DataDev TUG Inaugural Event
- Sherry Liao: Usability Testing - Tableau Desktop 2024.2
- Zeel Janani: Tableau Agent: Your AI-Powered Analytical Assistant
- Ann Pregler: How I Built This: Wellerman (Iron Viz Top 10)
- Louis Yu: Secrets of the Viz: My Tableau Journey featuring Shreya Arya
- Gurpreet Singh: How to Embed Tableau Pulse onto any Website or Dashboard
- Steve Wood: LOD equivalent of INDEX and RANK (part 2)
Visualizations
Dennis Kao: Panlong Ancient Road
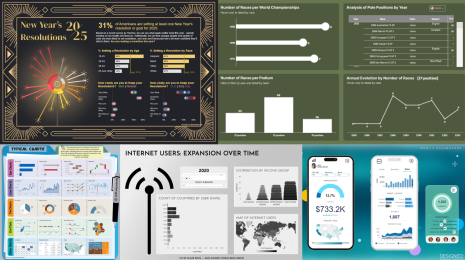
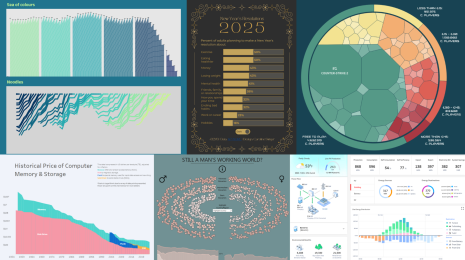
See the latest Viz of the Day, trending vizzes, featured authors, and more on Tableau Public.
Check out some inspirational vizzes created by the community:
- Michael Fajemilehin: Superstore sales - Product Overview
- Shangruff Raina: World Happiness Report 2024 | #MakeoverMonday
- Lara Willson: Work Arrangements | #MakeoverMonday
- Marcelo Has: Salesforce Email Marketing Campaigns
Community Projects
Back 2 Viz Basics
A bi-weekly project helping those who are newer in the community and just starting out with Tableau. Not limited just to newbies!
Web: Back 2 Viz Basics
X: #B2VB
Workout Wednesday
Build your skills with a weekly challenge to re-create an interactive data visualization.
Web: Workout Wednesday
X: #WOW2022
Preppin' Data
A weekly challenge to help you learn to prepare data and use Tableau Prep.
Web: Preppin’ Data
X: #PreppinData
Makeover Monday
Create business dashboards using provided data sets for various industries and departments.
Web: Makeover Monday
X: #MakeoverMonday
Visual Climate
Collaborate and share climate data.
Web: Visual Climate
X: #VisualClimate
DataFam Con
A monthly challenge covering pop culture and fandoms.
Web: DataFam Con
X: #DataFamCon
EduVizzers
A monthly project connecting real education data with real people.
Web: Eduvizzers
Viz for Social Good
Volunteer to design data visualizations that help nonprofits harness the power of data for social change.
Web: Viz for Social Good
X: #VizforSocialGood
Games Night Viz
A monthly project focusing on using data from your favorite games.
Web: Games Nights Viz
X: #GamesNightViz
Iron Quest
Practice data sourcing, preparation, and visualization skills in a themed monthly challenge.
Web: Iron Quest
X: #IronQuest
Storytelling with Data
Practice data visualization and storytelling skills by participating in monthly challenges and exercises.
Web: Storytelling with Data
X: #SWDChallenge
Project Health Viz
Uncover new stories by visualizing healthcare data sets provided each month.
Web: Project Health Viz
X: #ProjectHealthViz
Diversity in Data
An initiative centered around diversity, equity & awareness by visualizing provided datasets each month.
Web: Diversity in Data
X: #DiversityinData
Sports Viz Sunday
Create and share data visualizations using rich, sports-themed data sets in a monthly challenge.
Web: Sports Viz Sunday
X: #SportsVizSunday
Real World Fake Data
Create business dashboards using provided data sets for various industries and departments.
Web: Real World Fake Data
X: #RWFD
Data Plus Music
A monthly project visualizing the data behind the music we love!
Web: Data Plus Music
X: #DataPlusMusic
Articles sur des sujets connexes
Abonnez-vous à notre blog
Obtenez les dernières nouvelles de Tableau dans votre boîte de réception.


